-
Polar projections: Political geographies of Arctic mapping
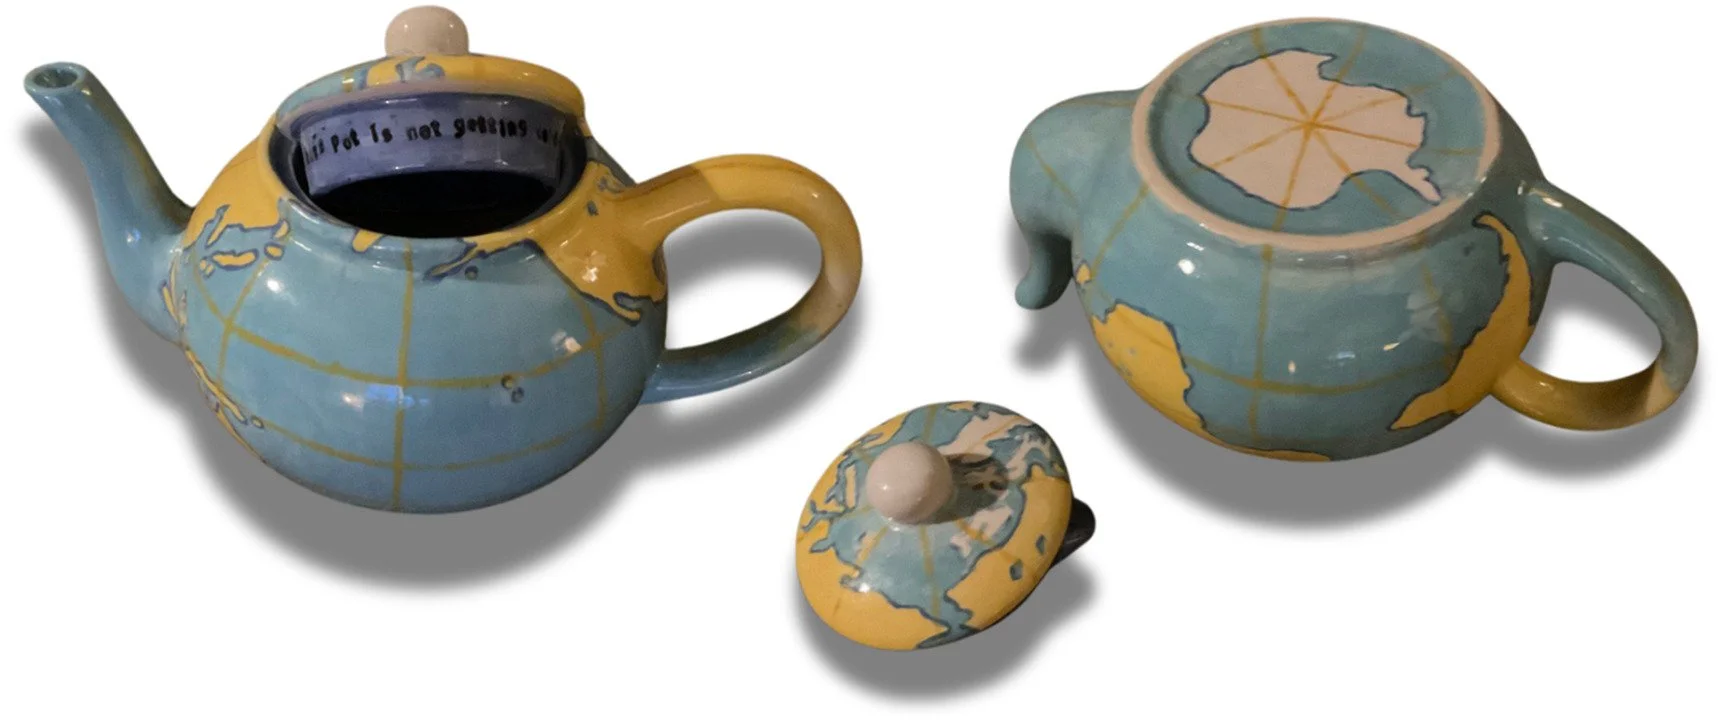
The Tea-Globe-Pot, a.k.a. the teapot projection
-

Mapping the Global Interplay of Droughts and Floods in a Changing Climate
EuroCarto 2024 Conference Abstract
-

Arctic Cartographic Uncertainties, a cARTographic Atlas in progress…
-
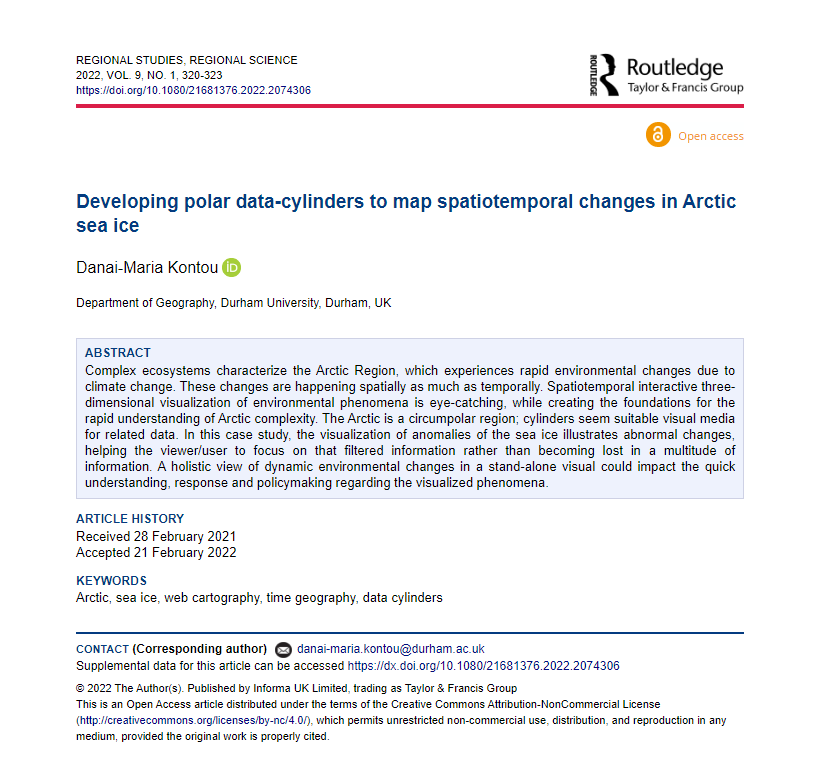
Developing polar data-cylinders to map spatiotemporal changes in Arctic sea ice
A short paper on the special issue “Innovative Graphics” in the journal “Regional Studies Regional Science
-

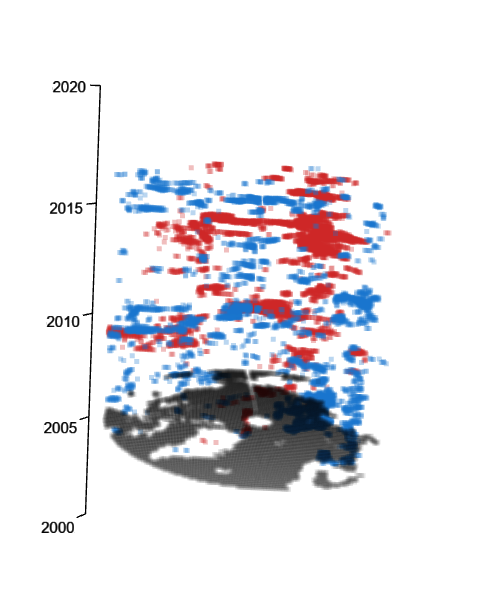
Poster on Sea Ice Arctic Data Cylinder
-

Preliminary Findings in the Cartographic Uncertainty of the Arctic in European Renaissance Maps
International Cartographic Conference, Abstracts Publications
-

Multi-layered poster on Arctic Cartographic Uncertainties
It needs blue and red classes to be read!
-
Interactive Polar Cylinder Web App
This web app was design as a supplementary element of the Master’s thesis “Developing Data Cylinders to map changes and feedbacks between Arctic Sea Ice and Vegetation”
Clip and pan to move the cylinder to any direction, scroll to zoom in and out. -

Developing Data Cylinders to map changes and feedbacks between Arctic Sea Ice and Vegetation
Master’s Thesis, Technical University of Dresden
-

Change detection of forests and semi-natural areas in Greece for the period 1990-2010
AEgean Journal of Environmental Sciences (AEJES)